
Business Insights with Power BI
Recently at work I was asked to create a Power BI report to show the revenue and cost of our software products. The report will be used to analyse the current financial performance and provide insights as to where we should / should not invest further. In this post I’ll share what I learned and how I did it.
Software Requirements
Part 1 - Getting data from our operations and project planning system
At Readify we use an operations and project planning system to track our clients, projects and the time our consultants work on those projects. It tracks the revenue we have made from our products and the time that we have spent building and maintaining those products. The data is saved and replicated in a SQL database in Microsoft Azure. In order to import that data to Power BI Desktop I needed to connect to the database. Instead of importing the entire database into the report, which would significantly slow down performance I first aggregated the data needed in a SQL View.
Creating a SQL View
A SQL view allowed me to select only the data I wanted to show in the report from the database. Below is an example of a SQL script which was used to create the view and select the data to be used in the Power BI report. (The script is mocked up but the syntax is there).
I created a SQL view for the product revenue and a view for the product costs. Once these views were created I imported them into Power BI.
Part 2 - Connecting and importing data into Power BI
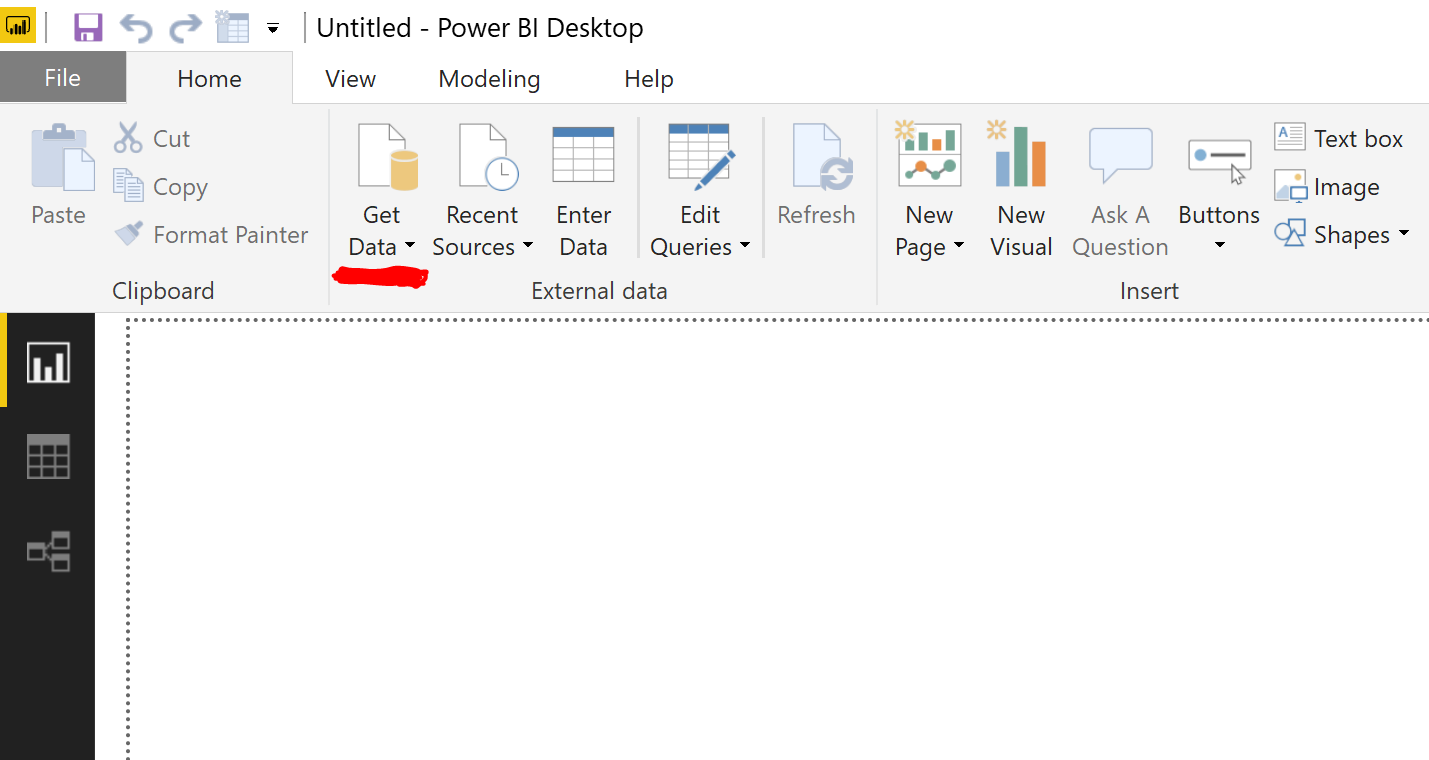
Select the data source. Get data -> SQL Server
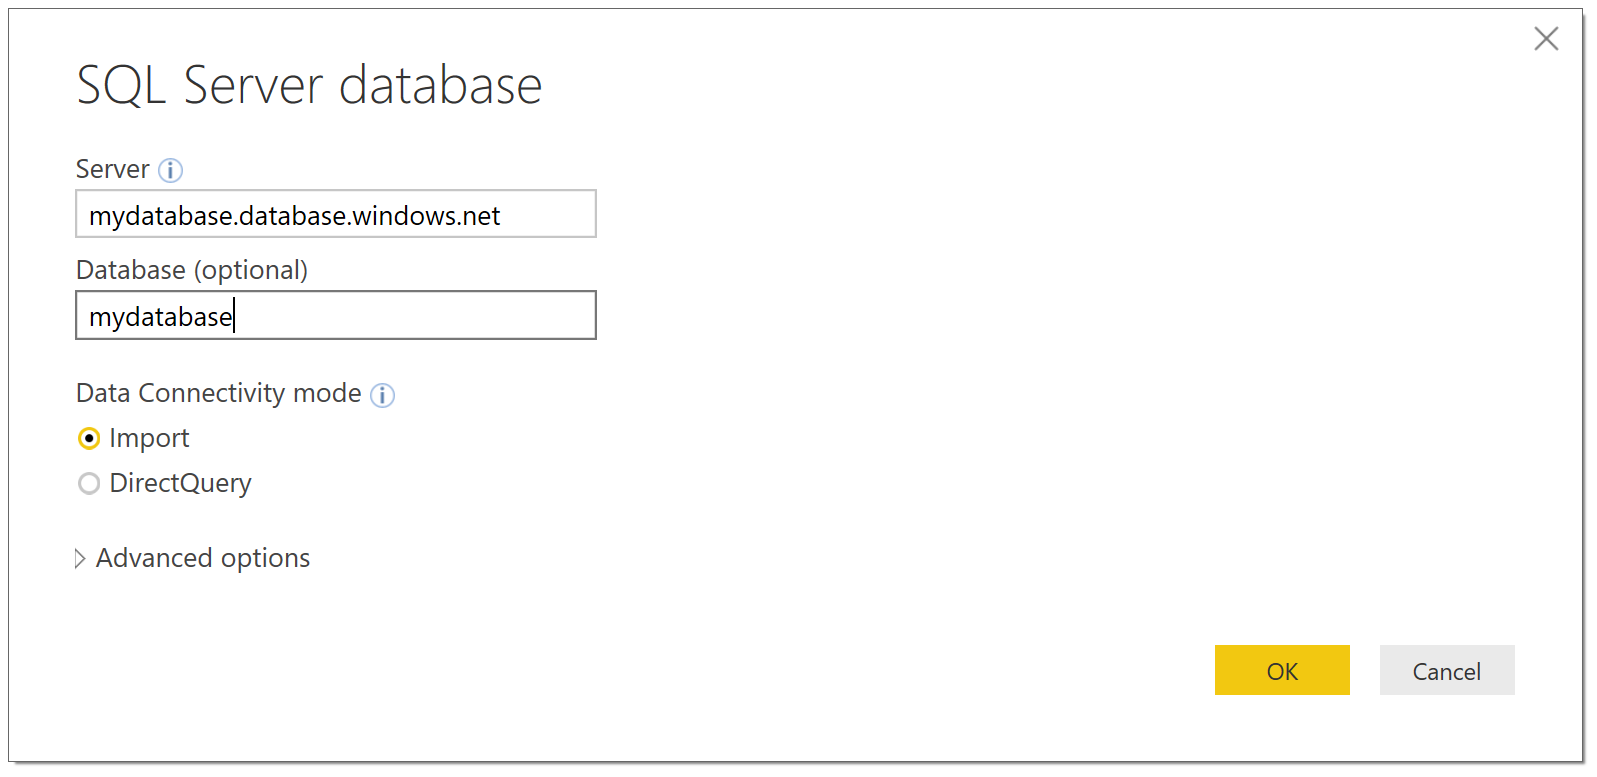
Input the server connection string and database name
Input database security credentials
To make sure the database is secured the report needs user access credentials. Depending on how the database is set up, this could be local Windows credentials, database account credentials or a linked Microsoft account.
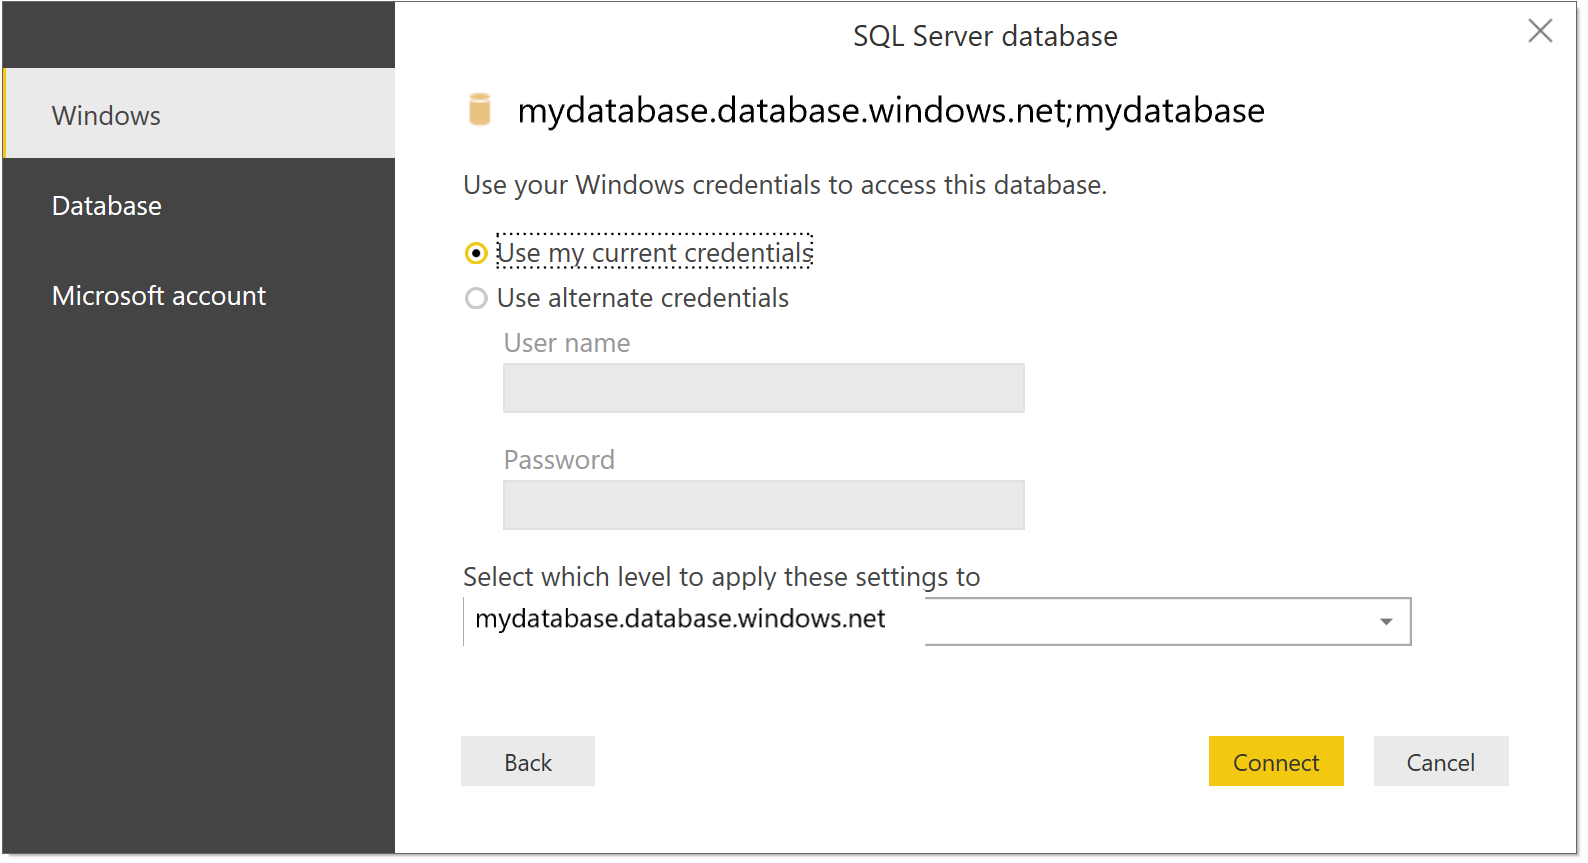
Input your database credentials
Select the SQL Views to import into Power BI
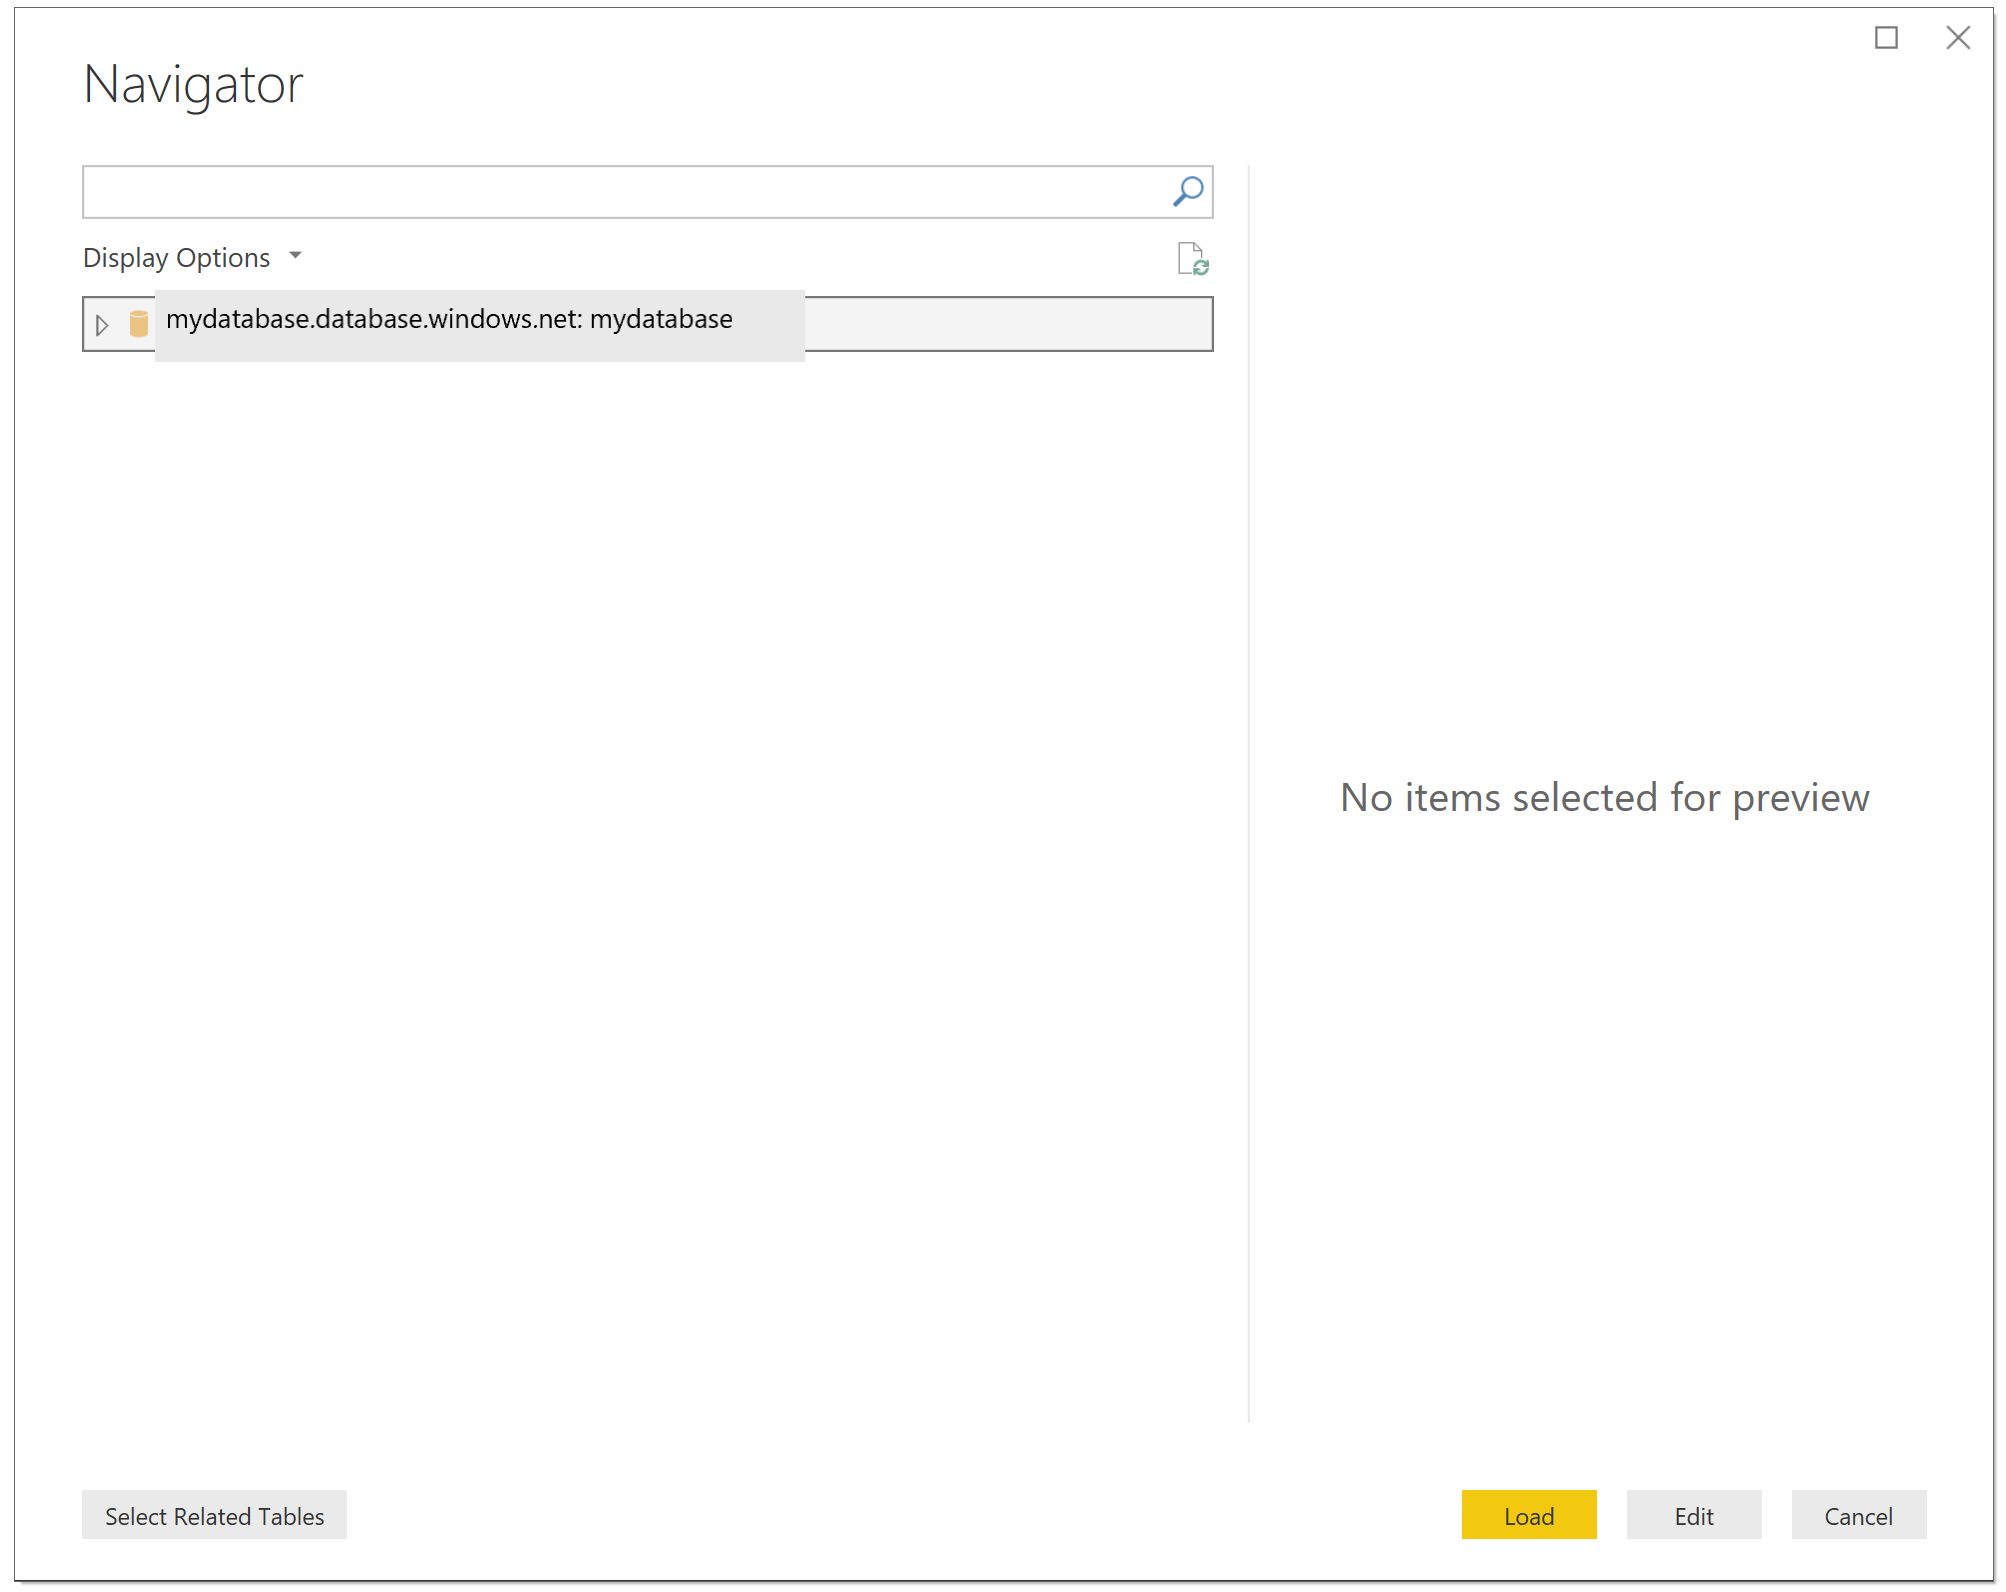
Select Database, select SQL views and click load.
Part 3 - Creating useful visualisations
Visualisations
It’s really easy to visualise data in Power BI using graphs, tables, matrices, cards and charts. This visualisation is a grouped bar chart. Drag and drop the values in, add colours, borders, backgrounds, titles, axes and more.
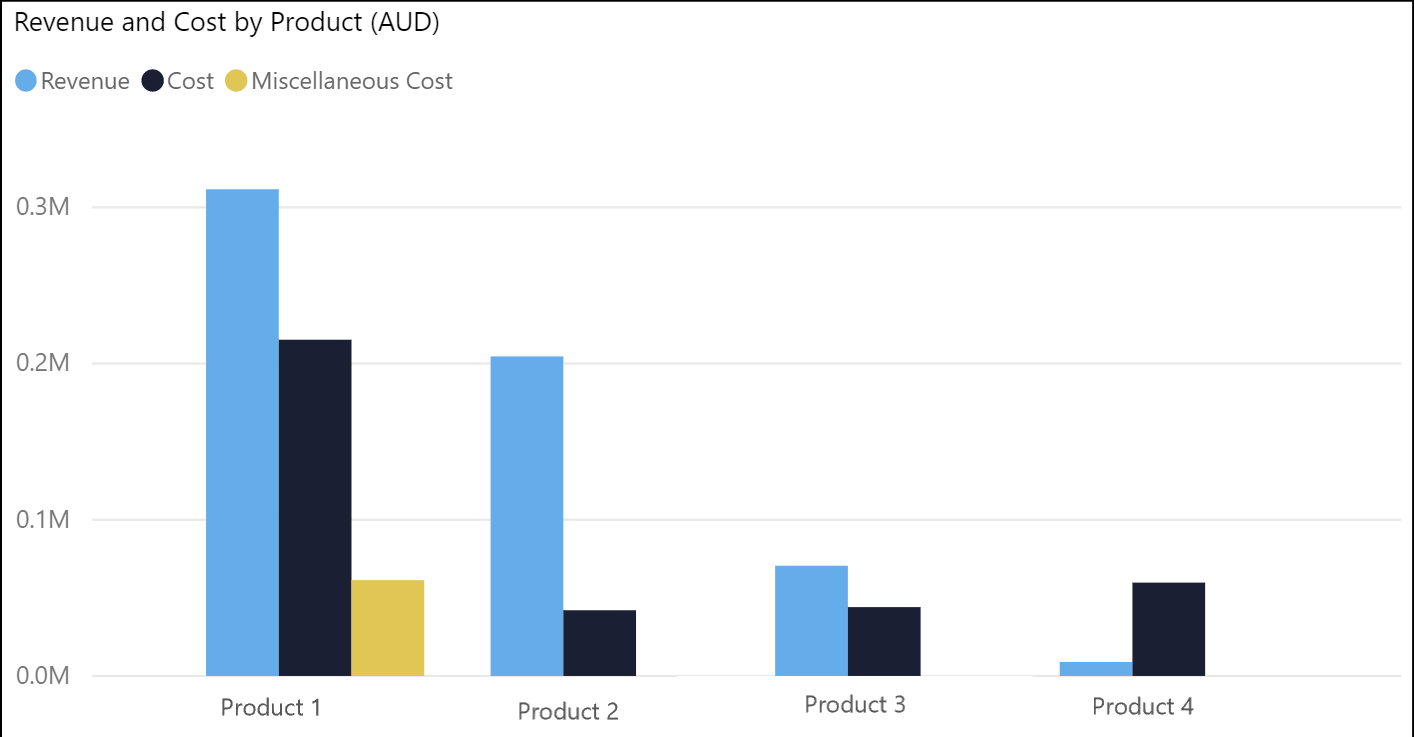
Product Revenue and Cost
Apply filters
Slicers can be used to allow the user to apply dynamic filters to the data so that they can quickly see specific metrics. For example, slicers were added so that the user could quickly see how a specific product was doing in the current financial year.
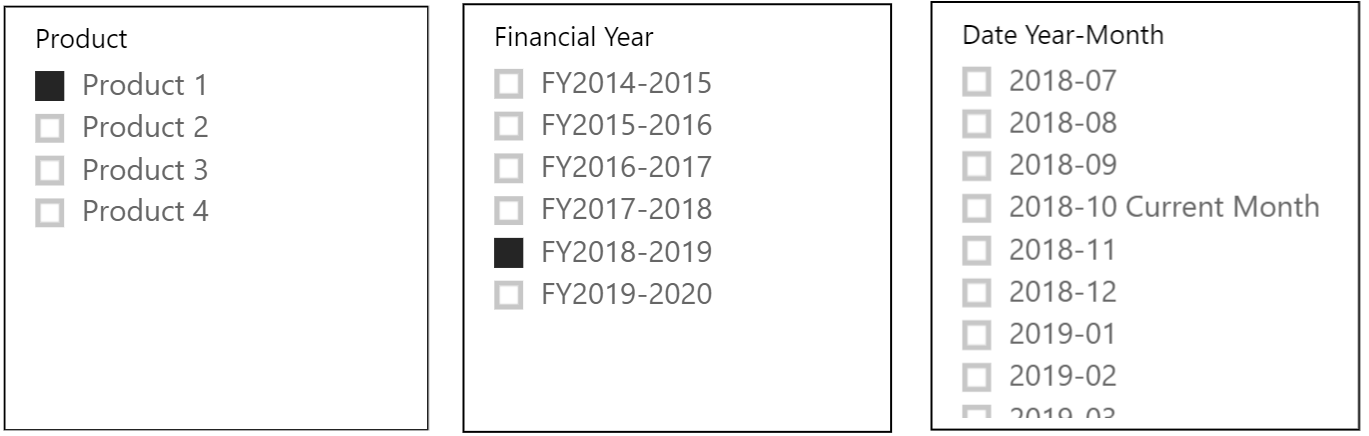 Slicers give the user the ability to dynamically filter the data
DAX Queries for specific measurements / calculations
Once the data was imported I used the Power BI visualisations to create graphs showing the revenue and cost by product. Here is a DAX query that I used to calculate the running total of the revenue.
This DAX query is saying ‘calculate the sum of all revenue values by date earlier than the last entry date’ (while taking into account any active filters on the report). This gave the running total of the revenue by date and was able to automatically recalculate the running total when a date filter or a specific product filter was applied.
Part 4 - Publishing
At Readify we have multiple environments to publish to in order to review and test the use and effectiveness of the report before it is shared with the rest of the business. For local testing and viewing purposes, the report is published to a local work space. For development and testing the report is published to a Development environment. This is then shared with the relevant stakeholders to test and give feedback for improvement. When the report is ready to be shared with the business, it is published to our Production environment which everyone can subscribe to. A git repository is also used to track the version of all of our Power BI business reports and accompanying documents.
Conclusion
It was great to take a question like ‘How are the products doing and where should we invest?’ to building out useful visualisations so that we have the ability to make informed decisions in the future. I’m excited to see what happens now. We have the data and we can see what’s happening. What are we going to do about it?